Skip to content

Introduction to Statistical Ideas and Methods

Online modules for introductory statistics

  • Home
  • Modules
    • Module 1 – Summarizing Data: One Variable
    • Module 1 – Summarizing Data: Relationships Between Variables
    • Module 2 – Probability: Events
    • Module 3 – Probability: Random Variables
    • Module 4 – Sampling Distributions
    • Module 5 – Data Collection
    • Module 6 – Confidence Intervals Part 1
    • Module 7 – Confidence Intervals Part 2
    • Module 8 – The Process of Statistical Tests
    • Module 9 – The Effective Use of Statistical Tests
    • Module 10 – Comparing Two Groups
    • Module 11 – Simple Linear Regression
  • Topics covered in each module
  • Data
    • The Skeleton Data
    • The New York Red Bulls Salary Data
    • The Life Expectancy Data
    • The Plastic Surgery Data
    • The Body Temperature Data
    • The HPV Vaccine Data
    • The Babies Crawling Data
    • The CFCs Data
    • The Anscombe Data
    • The Coffee Shop Nutrition Data
  • Probability Distribution Calculator
  • Statistical software
  • About

Explore the Skeleton Data

This learning activity and app will allow you to apply the summary statistics and plots covered in thisĀ module to explore the Skeleton Data. If you haven’t already, firstĀ read about the Skeleton Data here.

Follow the instructions in this learning activity (pdf).

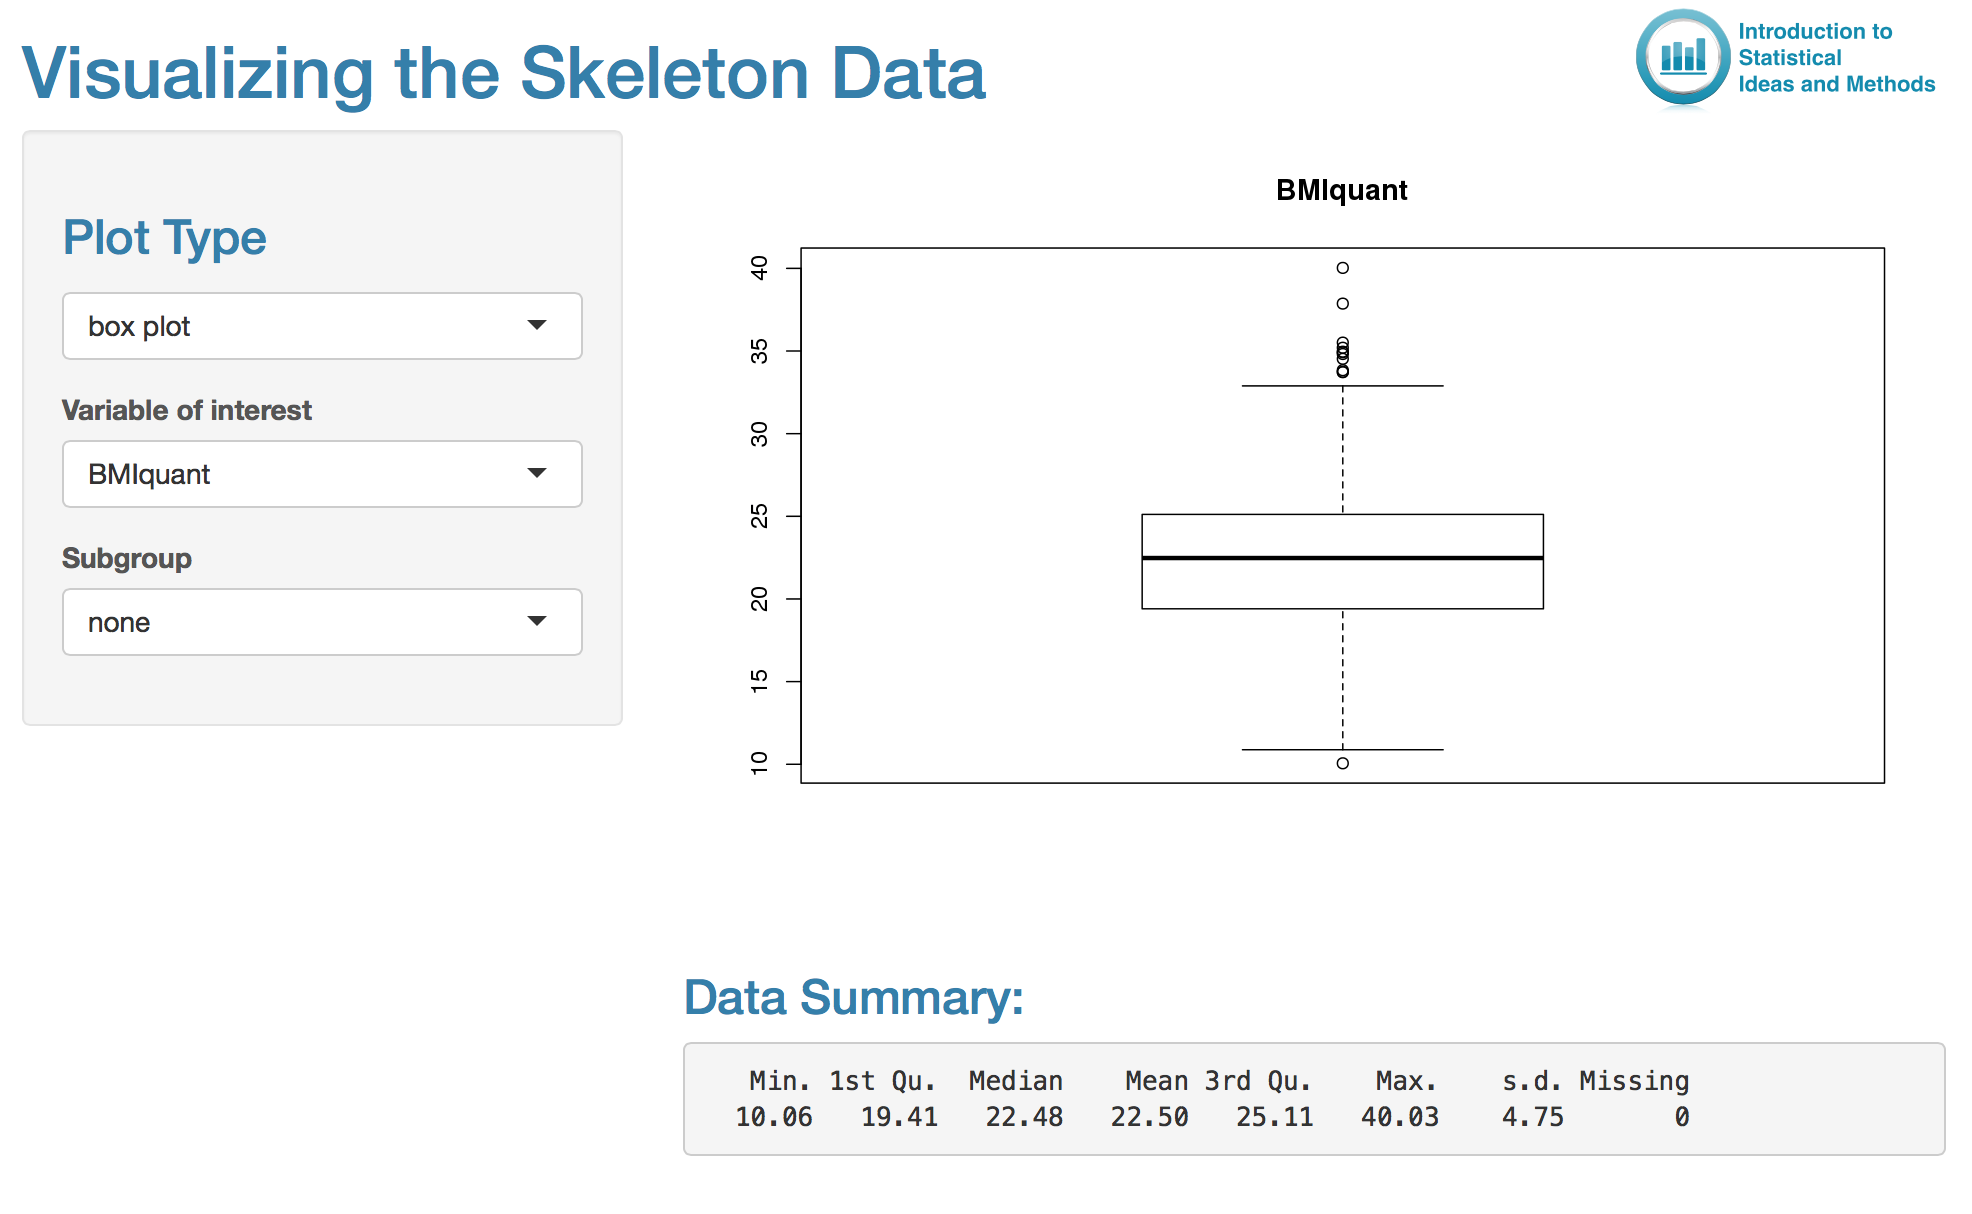
Click on the image of the app below to launch the app in a new browser window.

Screenshot of Shiny app Visualizing the Skeleton Data


Proudly powered by WordPress