Skip to content

Introduction to Statistical Ideas and Methods

Online modules for introductory statistics

  • Home
  • Modules
    • Module 1 – Summarizing Data: One Variable
    • Module 1 – Summarizing Data: Relationships Between Variables
    • Module 2 – Probability: Events
    • Module 3 – Probability: Random Variables
    • Module 4 – Sampling Distributions
    • Module 5 – Data Collection
    • Module 6 – Confidence Intervals Part 1
    • Module 7 – Confidence Intervals Part 2
    • Module 8 – The Process of Statistical Tests
    • Module 9 – The Effective Use of Statistical Tests
    • Module 10 – Comparing Two Groups
    • Module 11 – Simple Linear Regression
  • Topics covered in each module
  • Data
    • The Skeleton Data
    • The New York Red Bulls Salary Data
    • The Life Expectancy Data
    • The Plastic Surgery Data
    • The Body Temperature Data
    • The HPV Vaccine Data
    • The Babies Crawling Data
    • The CFCs Data
    • The Anscombe Data
    • The Coffee Shop Nutrition Data
  • Probability Distribution Calculator
  • Statistical software
  • About

Power for Testing a Proportion

This Shiny app and accompanying learning activity are designed to allow you to investigate the factors affecting power for a test of a proportion.

Follow the instructions in this Learning activity (pdf)

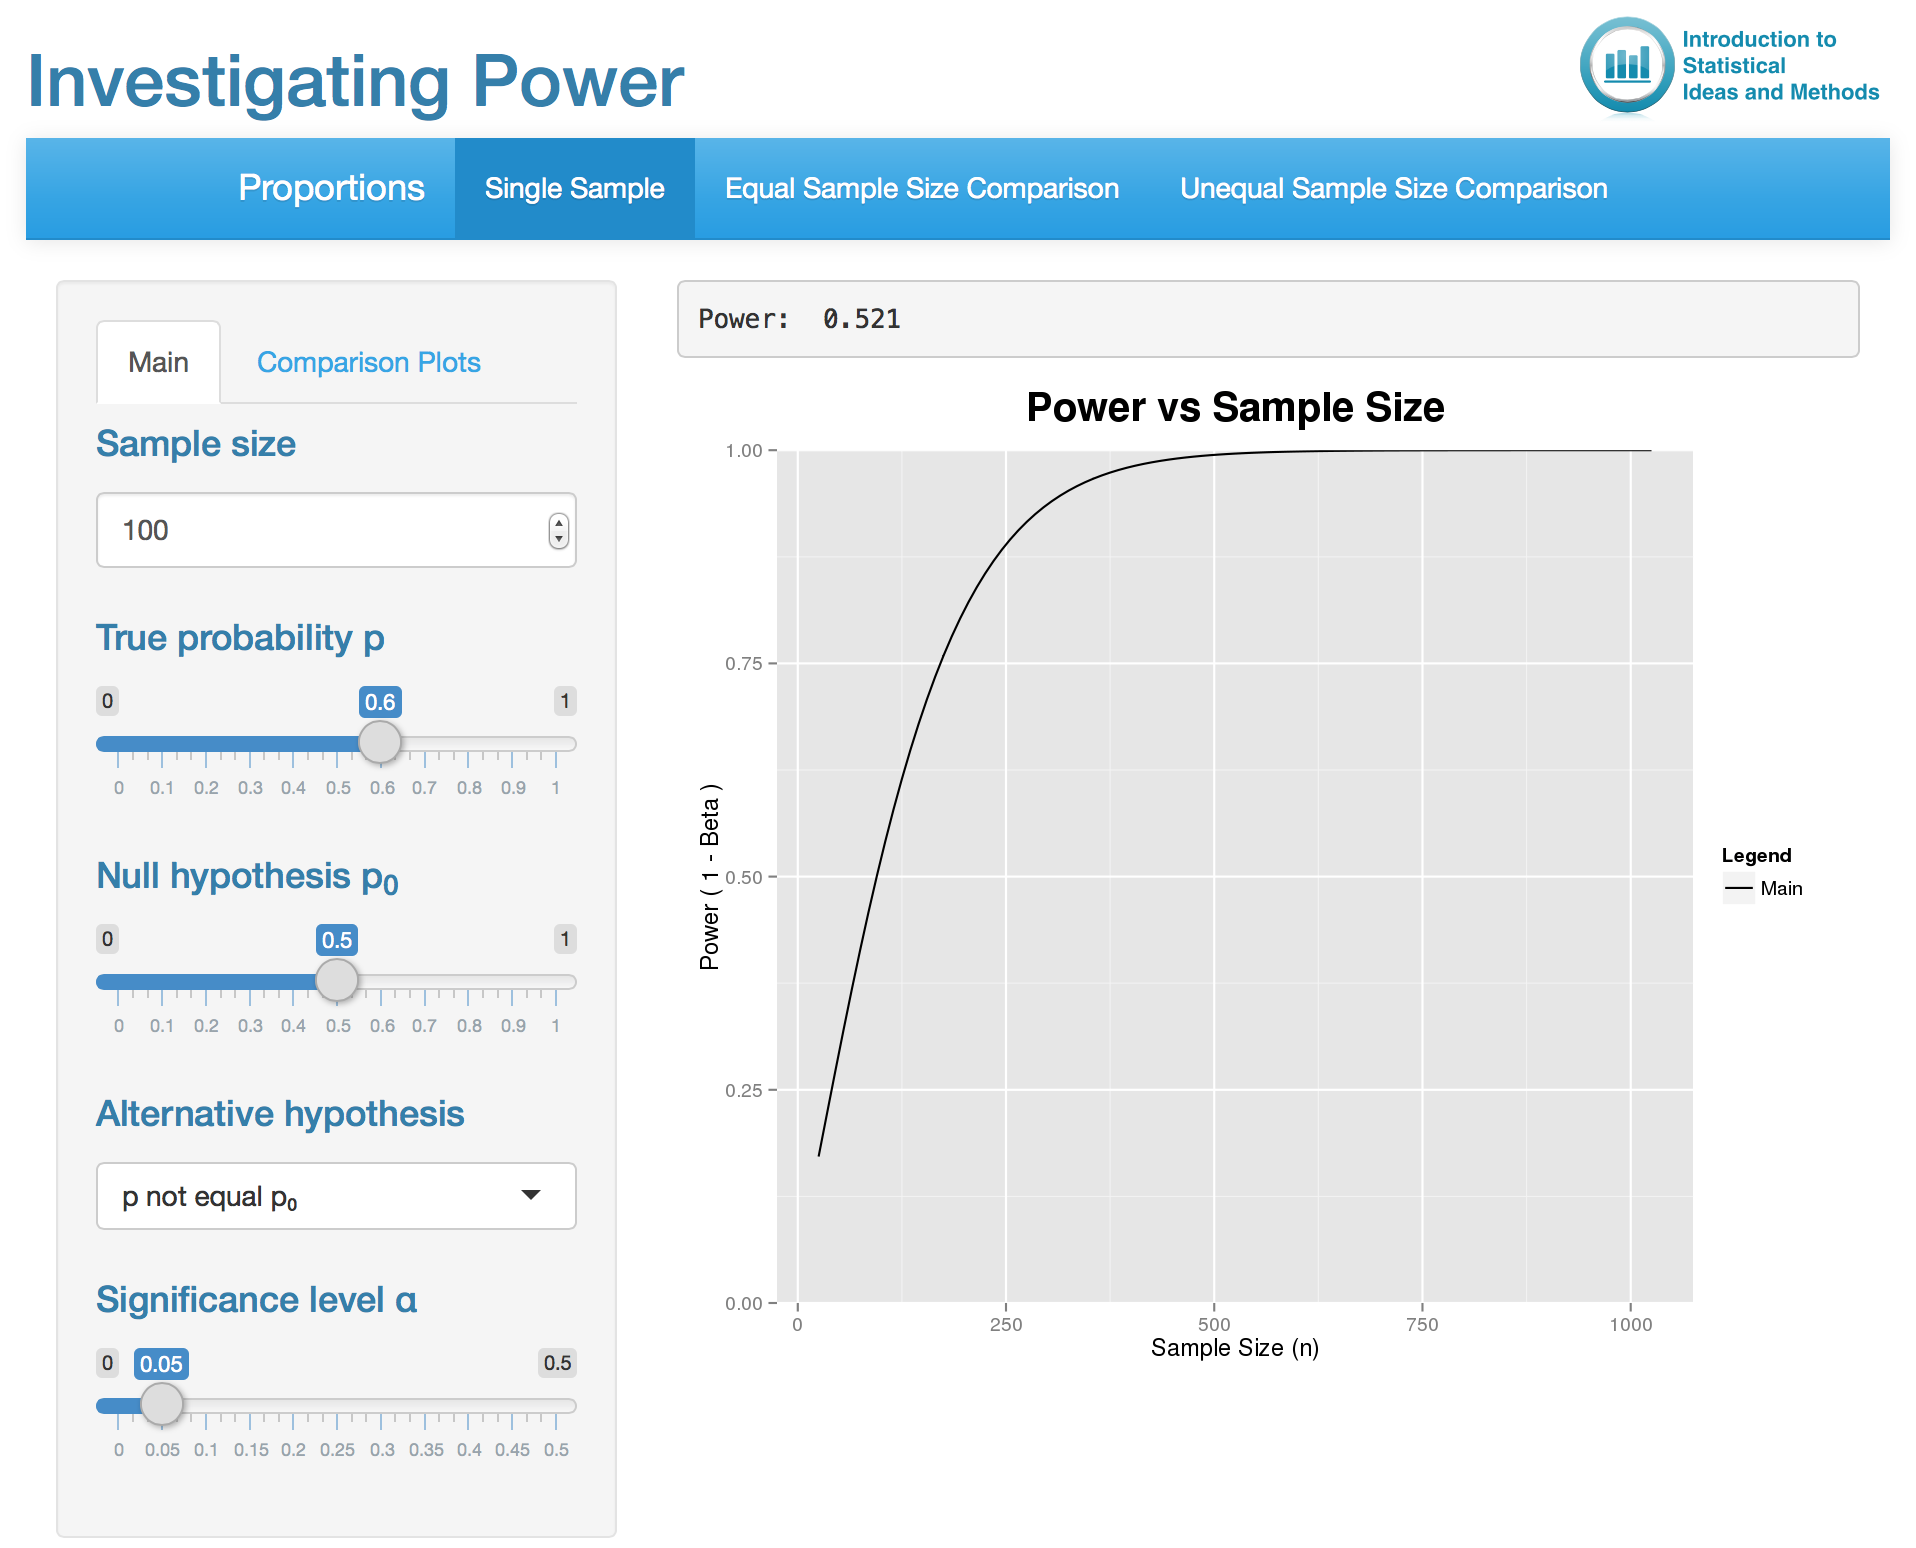
Click on the image of the app below to launch the app in a new browser window.

Screenshot of Shiny app Investigating Power


Proudly powered by WordPress