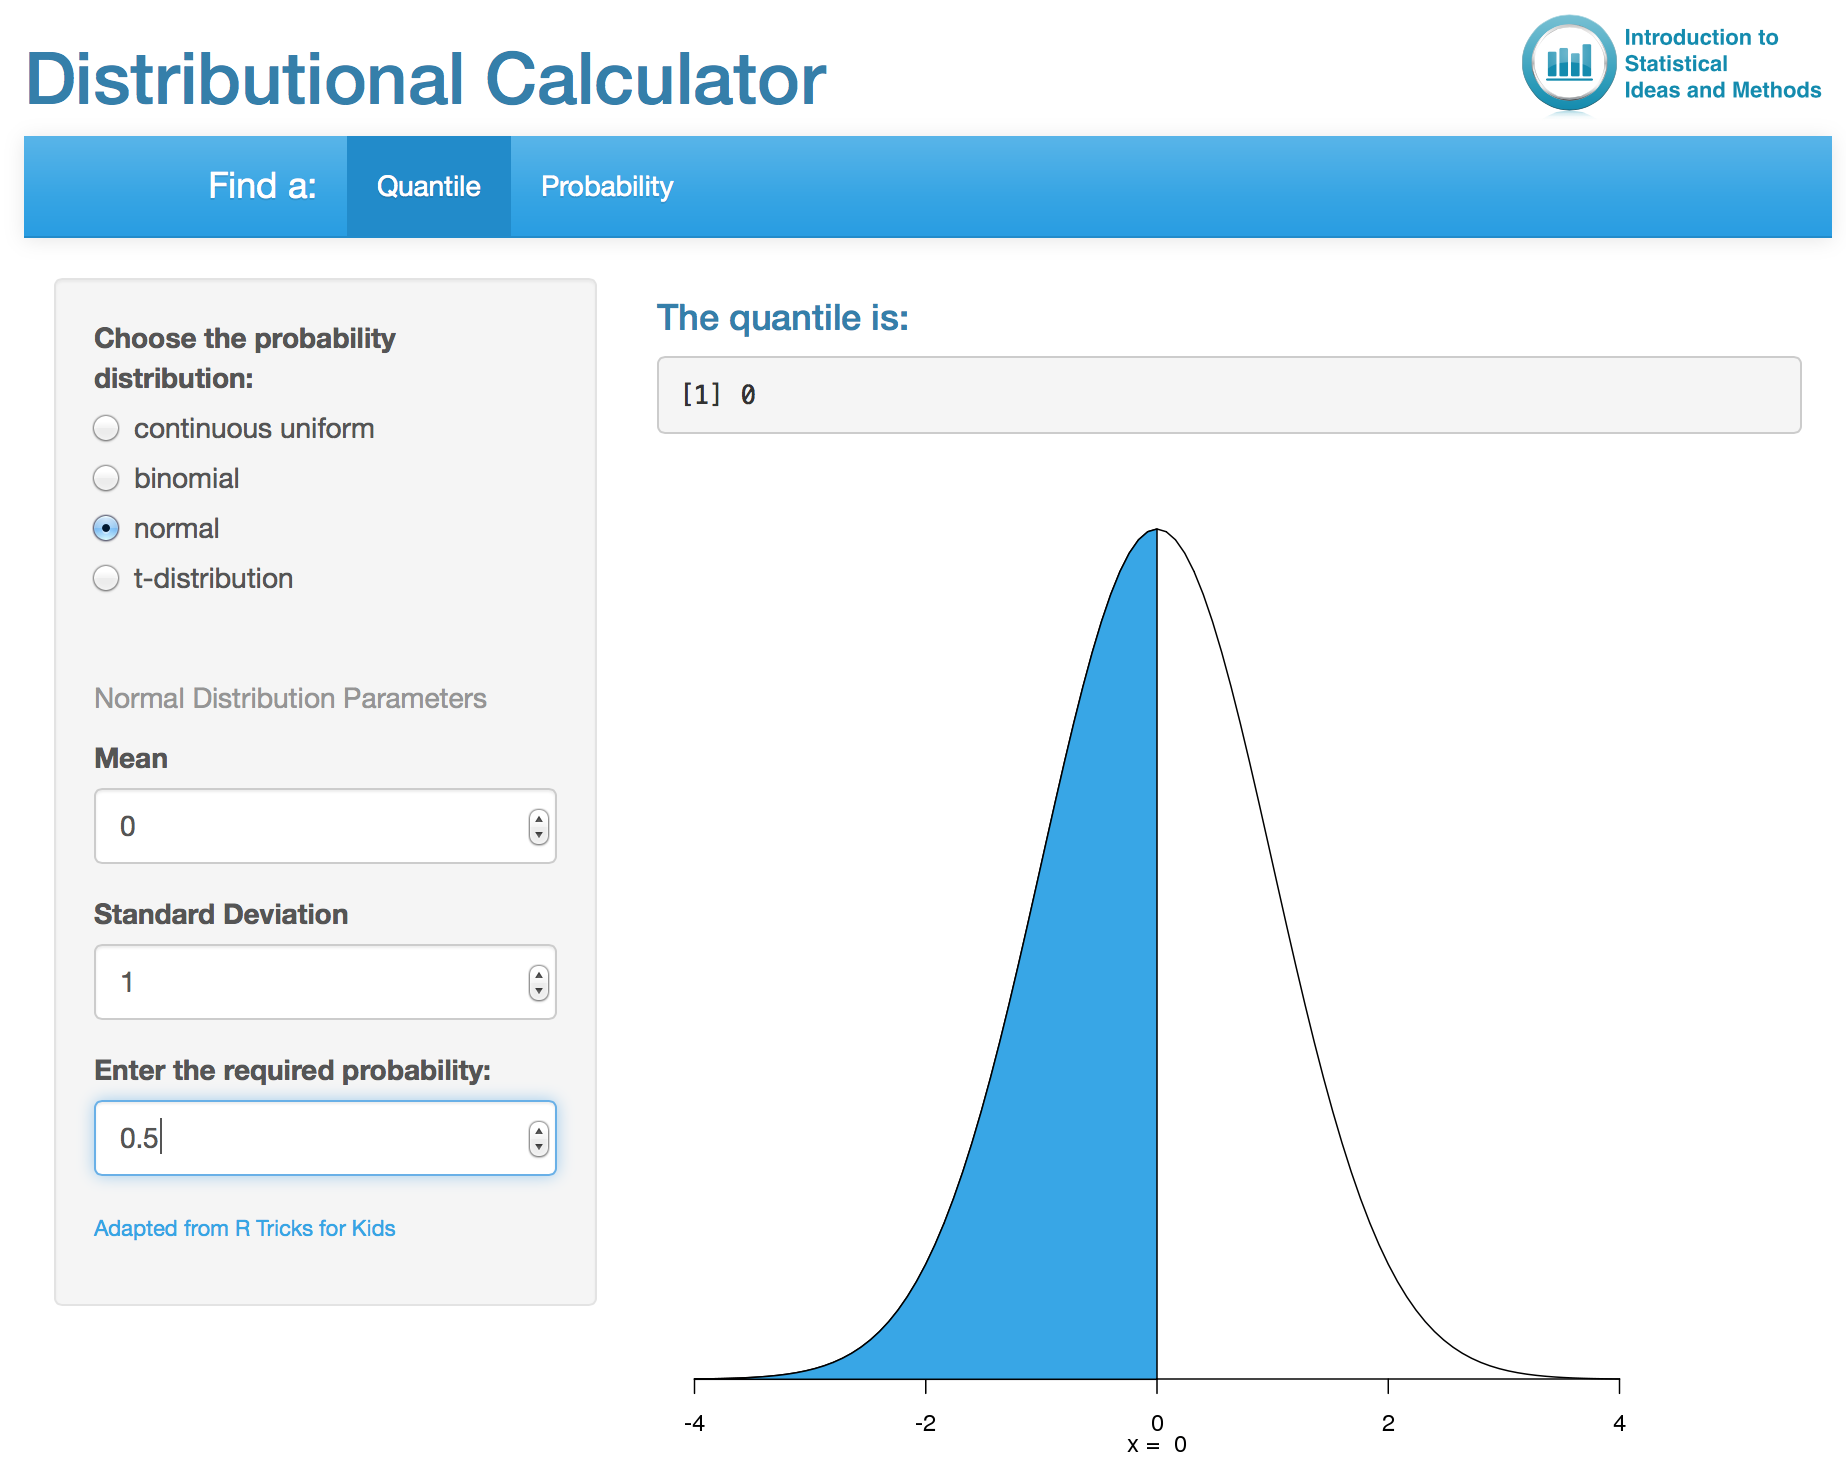
This Shiny app allows you to calculate the probability of being less than or equal to a value or to calculate the value that has specified probability of being less than or equal to it. The calculator gives these values for binomial, continuous uniform, normal and t distributions.
For a random variable with a given distribution, a quantile is the value from the distribution such that the probability of being less than or equal to it is a specified probability. Select the Quantile tab to find a quantile given a probability. Select the Probability tab to find a probability given a quantile.
Click on the image of the app below to launch the app in a new browser window.
This app was adapted from R Tricks for Kids (external link, opens in new window).
Probability Distribution Tables
Tables of probability distributions are available at the links below:
- Binomial Distribution Table (pdf)
- Normal Distribution Table (pdf)
- t Distribution Table (pdf)
The Normal and t Distribution Tables were obtained from OpenIntro Statistics (external link, opens in new window) and are licensed under the Creative Commons BY-SA 3.0 license.
